Tuesday, 24 February 2015

Gene Networks and Gene Clustering : Recent Advancements

Human genetic clustering analysis uses mathematical cluster analysis of the degree of similarity of genetic data between individuals and groups to infer population structures and assign individuals to groups that often correspond with their self-identified geographical ancestry. Gene Network is the complex network relating genes of people around the world.
We later illustrate that similar techniques can be used for analyzing Human Genetic Disease Networks which are of great use for mankind. 


Current state of art:


A Gene Network is an example of a Small World Network. So first of all I want to discuss about what exactly a small world network is and then i will discuss how we can think of a network to get some highly demanded applications .

"A small world network is a class of random graphs where most nodes are not neighbors of one another, but most nodes can be reached from every other by a small number of hops or steps (Perhaps the best known example of this is the 'six degrees of separation' feature discovered by Stanley Milgram in 1967.) . A small world network, where nodes represent people and edge connect people that know each other, captures the small world phenomenon of strangers being linked by a mutual acquaintance. The social network, the connectivity of the Internet, and gene networks all exhibit small-world network characteristics. The small world phenomenon (also known as the small world effect) is the hypothesis that everyone in the world can be reached through a short chain of social acquaintances. The small world problem asks for the probability that two people picked at random have at least one acquaintance in common."


                   Six degrees of separation.


Now lets discuss few ideas on how we will construct gene networks.

Considering people as nodes the degree of similarity between the genes will determine the edge construction between nodes. 

It has been found that there will be clusters of people together based on community and regions and we can analyze the inter-community relationships. We can guess/determine the origin of a particular community by these relationships. Apart from this we can find traits that are common like certain regions average height is bigger than other regions. Analyzing these patterns and relationships can reveal some interesting results.


Recent Advances have made Gene Clustering More Practical:


1) More than 200,000 people have already had their genomes sequenced as per 2014, a leader in this field a silicon valley company, Illumina says that this year 228,000 will sequence their DNA. More sequencing being we have more data to recognize patterns.

2) One argument for quick action is that the amount of genome data is exploding. The largest labs can now sequence human genomes to a high polish at the pace of two per hour.(The first genome took about 13 years)

3) The cost of genome sequencing has gone down from order of billion dollars to few thousand dollars, see the graph below :


http://www.genome.gov/sequencingcosts/

Few more implications / Proposed applications of gene networks :


Suppose friend of mine Rahul is suffering from a genetic disorder without a name. Doctors have tried to solve the case but are finding it difficult to cure him. There might be people around the who world have suffered with similar disorder but how to know them ? Since the disorder is genetic hope that we could find related genetic data. In this case clustering/gene networks might help to find similar patients. After finding similar patients doctors will have idea what was the history of the patient who suffered from the similar how were they cured or what was their average life etc. Recent studies have shown Human Disease Network and Disease gene network as shown below are useful( found them in Nature Magazine) .


    Human disease network (HDN).

In the HDN, each node corresponds to a distinct disorder, colored based on the disorder class to which it belongs, the name of the 22 disorder classes being shown on the right. A link between disorders in the same disorder class is colored with the corresponding dimmer color and links connecting different disorder classes are gray. The size of each node is proportional to the number of genes participating in the corresponding disorder (see key), and the link thickness is proportional to the number of genes shared by the disorders it connects. We indicate the name of disorders with 10 associated genes.


Disease gene network (DGN).


In the DGN, each node is a gene, with two genes being connected if they are implicated in the same disorder. The size of each node is proportional to the number of disorders in which the gene is implicated. Nodes representing genes with links to multiple classes are colored dark grey, whereas unclassified genes are colored light grey.  Only nodes with at least one link are shown.

References :

http://en.wikipedia.org/wiki/Human_genetic_clustering

http://www.nature.com

http://www.genome.gov/sequencingcosts/

https://books.google.co.in/


Monday, 23 February 2015

Time Constrained Networks

One of the key features of complex networks is that they capture interactions which have no limitations.  In most electronic systems, be they Facebook, emails or web pages, we can make connections across the world with little if any cost.
However what if there are constraints on the links made in a network? Surely we should change the way we study networks if space, time or some other constraint is having a significant effect on the formation or use of the network.  This has been a major interest of mine over the last few days. Space is one obvious limitation as in some cases long distance are less likely to be made. There has been a lot of work in this area over many decades but I will leave this constraint for another blog.
It is only more recently that the role of time in networks has began to receive more attention. A lot of this recent interest in how to deal with networks where the connections, are made at one time.  That is because most communication networks, emails, phone calls and so forth, are of this type. The recent review by Holmes and Saramäki (2012) is such temporal edge networks.

Yet networks are made of two parts: vertices and edges. My work has focused on the case where it is the vertices, not the edges, which are created at a definite time. In such temporal vertex networks, causality forces the interactions between nodes to always point in one direction. 
For example consider a citation network formed by academic papers. The nodes in our network are the academic papers and the links are formed by their bibliographies.  So if paper A refers to another paper B then we can be (almost) sure that A was written after B. Information can therefore flow only from B to A. In fact any set of documents can only refer to older ones such networks are common. In law, judges refer to previous judgments to support their arguments.  When registering a patent, prior art needs to be cited, that is other previously granted work which may have some relevance to the current claim.

The same types of structure occur in several other situations.  Any situation where there is a logical flow has the same causal structure.  If we have a project where the nodes represent individual tasks then an edge from task S to task T could represent the fact that task T requires task S to have been completed before task T is started.  This has been the focus of work on temporal vertex networks in computer science. The logical flow of a mathematical argument or an excel spreadsheet show the same properties.  These networks define what is called a partially ordered set or poset and it is under this title that you find relevant work coming from mathematicians. A final example comes from theCausal Sets approach to quantum gravity.  Here space-time is discrete not continuous, and these discrete points are the nodes of the network.  The nodes are connected by edges only if they are causally connected and causality again gives these a common direction.

All of these temporal vertex networks have a key property.  That is they contain no loops if you always follow the direction on the edges.  You can not go backwards in time.  Thus the traditional name for such a network is a directed acyclic networks or DAG for short.
So the question is how can we adapt traditional network measures to deal with the fact that these networks, DAGs, are constrained by causality?  Are there new measures we should employ which give more insights to such networks?

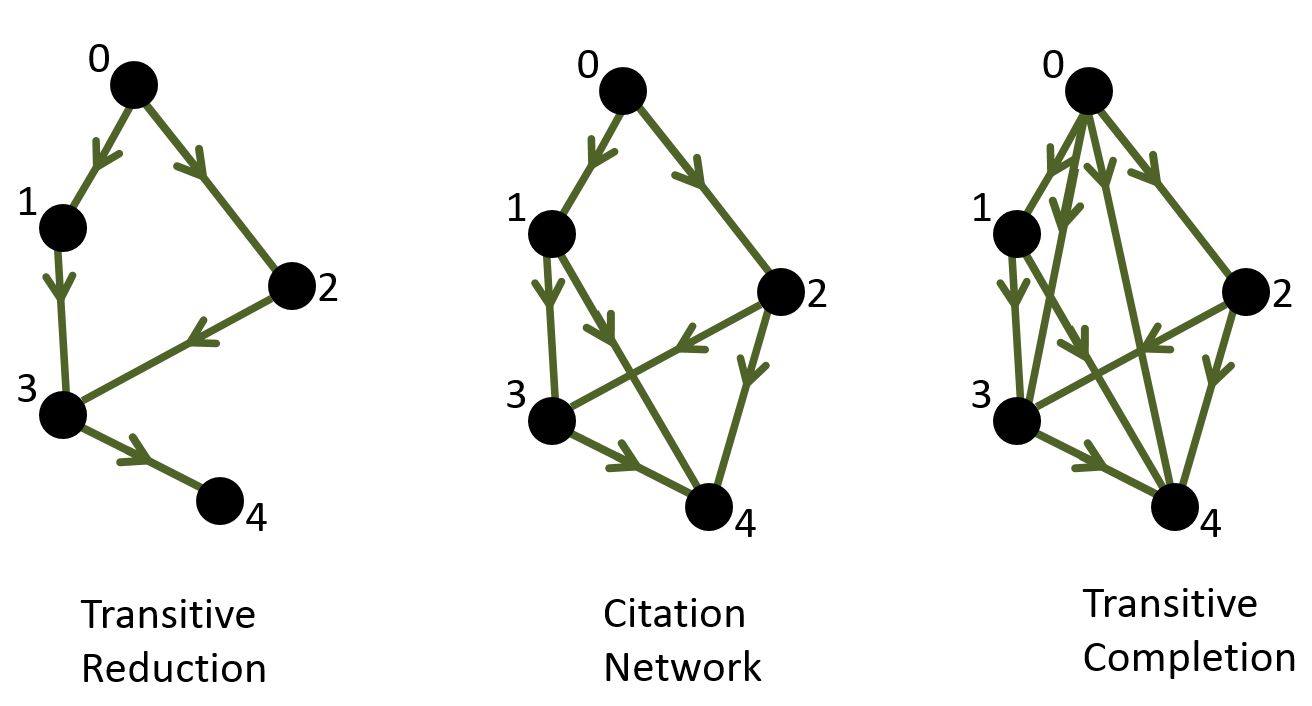
Paths in networks are always important.  However one feature of a DAG we have been exploiting is that if we always follow the direction of the arrows, the direction of time, then not all nodes are connected. If we like we could add edges whenever there is such a path connected a late node to an earlier one, a process known as transitive completion.  On the other hand we could remove as many edges as we can while leaving the causal relationships intact, a process known as transitive reduction. That is, if there is a path between two nodes in the network before transitive reduction, then there will still be a link afterwards.

Example of the transitive reduction (left) and the transitive completion (right) of the directed acyclic graph in the centre.

What i have done (in Transitive Reduction of Citation Networks) is look at how real data from citation networks behaves after transitive reduction.  What we can find is that different types of citation network behave very differently. The citation network formed from academic papers taken from the arXiv repository and the network of US Supreme Court judgments both show that about 80% of the edges are not needed to retain all the causal relationships.  On the other hand the patents network shows the opposite behaviour with all but 15% of edges being essential. The edges removed tend to be the citation to older papers. One interpretation is that academics and and judges may be citing well known early papers and judgments though their current work is only directly related to more recent documents. 
The number of citations to a document after transitive reduction certainly gives us a different view of the importance of different documents. For instance paper hep-th/9802109 on the arXiv (Gauge Theory Correlators from Non-Critical String Theory by Gubsner et al.) was cited by 1641 papers in the network, but only three citations remained after TR! On the other hand, paper hep-th/9905111 (Large N Field Theories, String Theory and Gravity by Aharony et al.) has also large number of citations in the raw data, 806, yet after transitive reduction it has 77, so retaining far more of its original citations. Perhaps information in the second paper was used more diversely.
We can find similar examples in the US Supreme Court citation network. The case Schneider vs. New Jersey (1939)’ has 144 citations in the original data but this drops to just just one after transitive reduction. Stromberg vs. California (1931) also falls from 132 citations to just one. Conversely, the case Heller vs. New York (1973) only shows a slight fall after transitive reduction, falling from from 68 to 48 citations and has the most citations in our reduced network. The second most cited case after transitive reduction is Hamling vs. United States, which drops from 68 to 38 citations. Wikipedia lists hundreds of Supreme Court cases but the last two are not famous enough to make the Wikipedia list.  Our analysis suggests they may have more importance than a simple citation count would suggest. At the very least it might be be worth checking out documents that are highly cited in the essential.
Another way to look at citation networks is to see if we can define a dimension to the network.  That is we can try to quantify how much variation there is in the citation process.  A low dimension means that there are few directions , few distinct themes relevant for citation in a document.  A high dimension indicates that there is a wide range of relevant but distinct directions from which a document will draw on for inspiration.  
For academic papers, we found that different fields of research have different dimensions.  For papers in the hep-th arXiv section (largely string theory) we found a low dimension of around 2 while for theoretical papers closely linked to particle physics experiments (hep-ph section) we found more variation as indicated by a higher dimension of 3. The quant-ph also around 3 while the astro-ph section had a slightly higher dimension of around 3.5. So clearly despite similarities in the main data using standard measures, our time-aware dimension measures show clear differences in the citation behaviour of different areas. String theory in particular seems to be a tightly knit collection of work with each work largely dependent on all the other work, few independent directions can be pursued. The US Supreme Court judgments were more complicated.  Small samples (usually from modern judgments) showed a dimension of around 2.5 to 3 but larger samples, typically ranging from modern to the earliest judgments, had lower dimensions, closer to 2. We interpreted this as reflecting the way that there were few early judgments compared to the number produced to day.  So that the further back we traced in time to find the influence of judgments on recent ones, the smaller the variation.  Perhaps that is not so surprising and we might expect a similar shape if we could follow scientific papers back to the 18th century! patents on the other hand showed a much higher dimension though again these were involved.

It is clear from just the few studies we have made that time makes a crucial difference to the structure of a network. We have tried a few new measures adapted to take account of time and in doing so we have thrown up some intriguing features in real data.  There is surely much more to find when networks are embedded in time.
References
Clough, J. R.; Gollings, J.; Loach, T. V. & Evans, T. S., Transitive Reduction of Citation Networks, J.Complex Networks to appear 2014, arXiv:1310.8224 DOI: 10.1093/comnet/cnu039 (open access)
Dowker, F. Causal sets as discrete spacetime, 2006. Contemporary Physics, 47, 1-9
Holme, P. & Saramäki, J. 2012. Temporal Networks Physics Reports, 519, 97-125
Simkin M.V. and Roychowdhury V.P., 2003. Read before you cite! Complex Systems 14 269-274

SMALL WORLD !!!


A small world network is a class of random graphs where most nodes are not neighbors of one another, but most nodes can be reached from every other by a small number of hops or steps. A small world network, where nodes represent people and edge connect people that know each other, captures the small world phenomenon of strangers being linked by a mutual acquaintance. The social network, the connectivity of the Internet, and gene networks all exhibit small-world network characteristics. The small world phenomenon (also known as the small world effect) is the hypothesis that everyone in the world can be reached through a short chain of social acquaintances. The small world problem asks for the probability that two people picked at random have at least one acquaintance in common.


It is observed that in most of the large networks, the distance or path-length between any two nodes does not increase in proportion to the number of nodes in the network. Perhaps the best known example of this is the 'six degrees of separation' feature discovered by Stanley Milgram in 1967. He found that between most pairs of people in the USA there is typically a network distance of just six acquaintances. This is commonly referred to as a small-world feature in a network. It can occur even in random networks , for which Erdős and Rényi had shown that the typical distance between any two nodes scales as the logarithm of the total number N of nodes.


Milgram’s idea stood discredited for some time, but got extensive endorsement later. A Microsoft team (E. Horvitz and J. Leskovec) studied the addresses of 30 billion Microsoft Messenger instant messages sent during a single month (June) in 2006. Two people were taken to be acquaintances if they had sent each other an instant message. It was found that any two persons on average are linked by seven or fewer acquaintances.

Another feature of social and many other networks is the occurrence of cliques. In social networks, cliques are groups of friends or acquaintances in which everyone knows every other member of the group. Theclustering coefficient of a network serves as a good measure of this tendency to form clusters or cliques (Wasserman and Faust 1994Watts 1999). Consider a particular node i. Suppose it is connected to kiother nodes. If these other nodes are part of a clique (which naturally includes the node i also), there would be ki(ki - 1)/2 edges among them. Suppose the actual number of edges among them is Ei. Then the clustering coefficient of the node i is defined as
Ci = [2Ei]/[ki(ki - 1)].
And the clustering coefficient C for the entire network is the average of all the Ci’s.
For a random network, C = p (every pair of nodes is connected with a probability p). For practically all real networks, C is much larger than p, indicating that the small-world characteristic is indeed very common in complex networks.

Small-world networks have short path lengths like random networks, and have clustering coefficients that are quite independent of network size, like regular networks. This last feature of regular networks or graphs is well illustrated by a crystal lattice, in which the clustering coefficient is fixed, no matter what the size of the crystal is. Consider, for simplicity, a ring lattice, i.e. a 1-dimensional lattice with periodic boundary conditions. Let each node be connected to k other nodes nearest to it. It has a high clustering coefficient because most of the immediate neighbours of any lattice point are also neighbours of one another. Its clustering coefficient can be shown to be

C = [3(k-2)]/[4(k-1)]

A low-dimensional lattice like this does not have short path lengths. For a d-dimensional cubic lattice, the average distance between two nodes scales as N1/d; this is a much faster increase with N than the logarithmic increase typical of random networks, as also of most of the real-life networks.

The Watts-Strogatz model

As stated above, real small-world graphs or networks have short path lengths unlike ordered or regular networks, and have clustering coefficients that are quite independent of network size, unlike random networks. Watts and Strogatz (WS) (1998) proposed a one-parameter model that explored the regime intermediate between random graphs and regular graphs. They started with a ring lattice of order N, in which each node is connected to its nearest k nodes, k/2 on either side. For ensuring that they were dealing with a sparse but connected network, they assumed that N>>k>>ln(N)>>1. Then they introduced randomness by rewiring each conceivable edge with a certain probability p. Thus even distant nodes had a chance of being connected. In fact, the procedure introduced pNk/2 long-distance edges connecting nodes which would have been parts of different neighbourhoods otherwise.


Connection probability p = 0 corresponds to perfect order or regularity, and p = 1 to randomness.Somewhere between these two limits a transition occurs from order to randomness (or chaos). This transition is of great interest in the context of complex systems, because this ‘edge of chaos’ is where complexity thrives. It is in the vicinity of the edge of chaos that the network exhibits a coexistence of clustering and short path lengths.

For a ring lattice, i.e. when p = 0, the average path length is
L(0) ≈ N/(2k) >> 1
And the average clustering coefficient is
C(0) ≈ 3/4
Thus the average path-length scales linearly with order, and the average clustering coefficient is large.
At the other extreme in the WS model, i.e. when p → 1, the model describes a random graph, for which

C(1) ≈ Crandom ~ k/N << 1
and
L(1) ≈ Lrandom ~ ln(N)/ln(k)

Thus the clustering coefficient decreases with increasing order of the net, and the path length increases logarithmically with order.

The WS model has the feature that there is a substantial range of probabilities p for which large C values coexist with small L values, in agreement with what is observed in a variety of real networks. However, it is not able to reproduce the power-law degree-distribution exhibited by many real networks for large k.


References :

1.  link-1
2.  link-2
3.  https://books.google.co.in/